Operations Monitor
Your customer should not be the one who tells you it is down
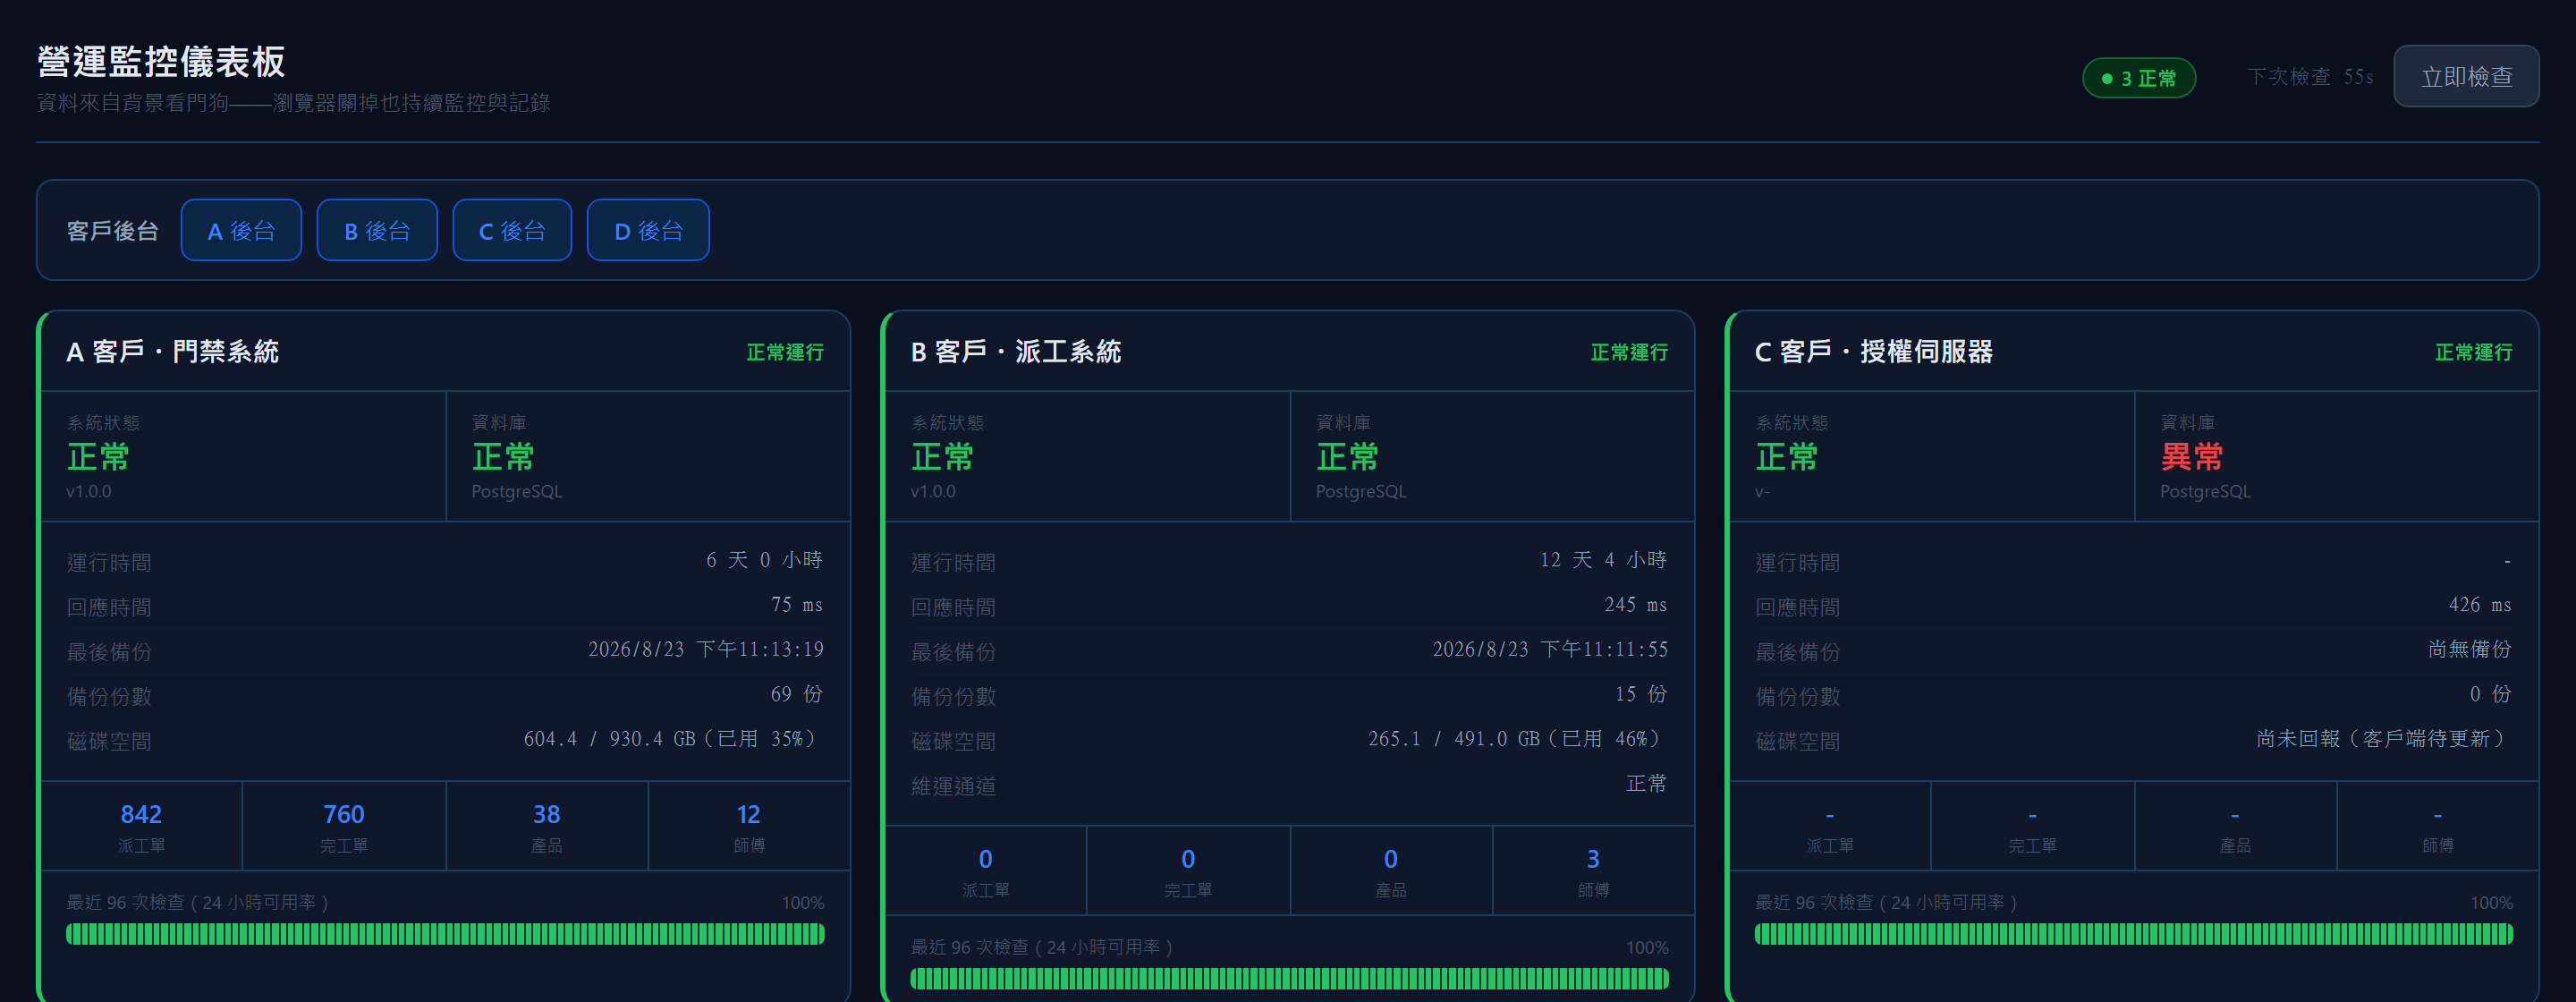
Every system gets a health check every minute, and anything abnormal raises an alert. It exists for one reason: so that a phone call from a customer is no longer how you find out.
- Type
- Internal operations tool
- Scope
- Monitoring engine
- Alerting
- Project rollup
- Daily brief
- Industry
- Software operations
The challenge
A one-person company running several customer systems has no night shift. The risk is not that something breaks - something always breaks - it is that nobody notices until the customer runs out of patience and calls. What that call costs is not the downtime. It is the belief that somebody is watching.
What we built
A check every minute, an alert the moment it turns
Health endpoints are polled continuously and a desktop notification fires on the first bad result, so nobody has to sit watching a screen.
The maintenance tunnel is monitored separately
A customer rebooted, port forwarding vanished, and the tunnel stayed down for two days unnoticed - because the website itself was fine. "The service is up" and "everything is fine" are two different questions.
Every project rolled onto one page
Development history and version state are scanned and summarised, answering where each project stopped and what it is blocked on without opening a single folder.
An automatic brief every evening
A scheduled summary of the day, so remembering what actually got done is not left to memory.
Zero dependencies, on purpose
Built entirely on the runtime's built-in modules with no third-party packages. A monitoring tool that becomes its own source of failure has defeated its purpose.
Where else it works
The core of this is not website monitoring. It is asking the same question continuously and raising a hand the moment the answer changes. Anywhere something reports its own state, the same approach transfers.
Industrial IoT
Sensors, controllers and production machines rolled onto one page, with anomalies pushed to a phone instead of waiting for the next inspection round.
Cold chain and environment
Temperature, humidity, power and water level reported continuously, with an alert the moment a reading leaves its band - because the loss usually happens when nobody is watching.
Multi-site operations board
Systems, point of sale and network status across every branch on one screen, so head office stops phoning each location in turn.
Monitoring what you delivered
Put delivered systems under watch so you know before the client calls, and know which part failed.
Wondering whether a system like this would fit your company?
No specification needed. Tell us which part of your work takes the most time, and we will look at the right approach together.
More work
See all 12 projects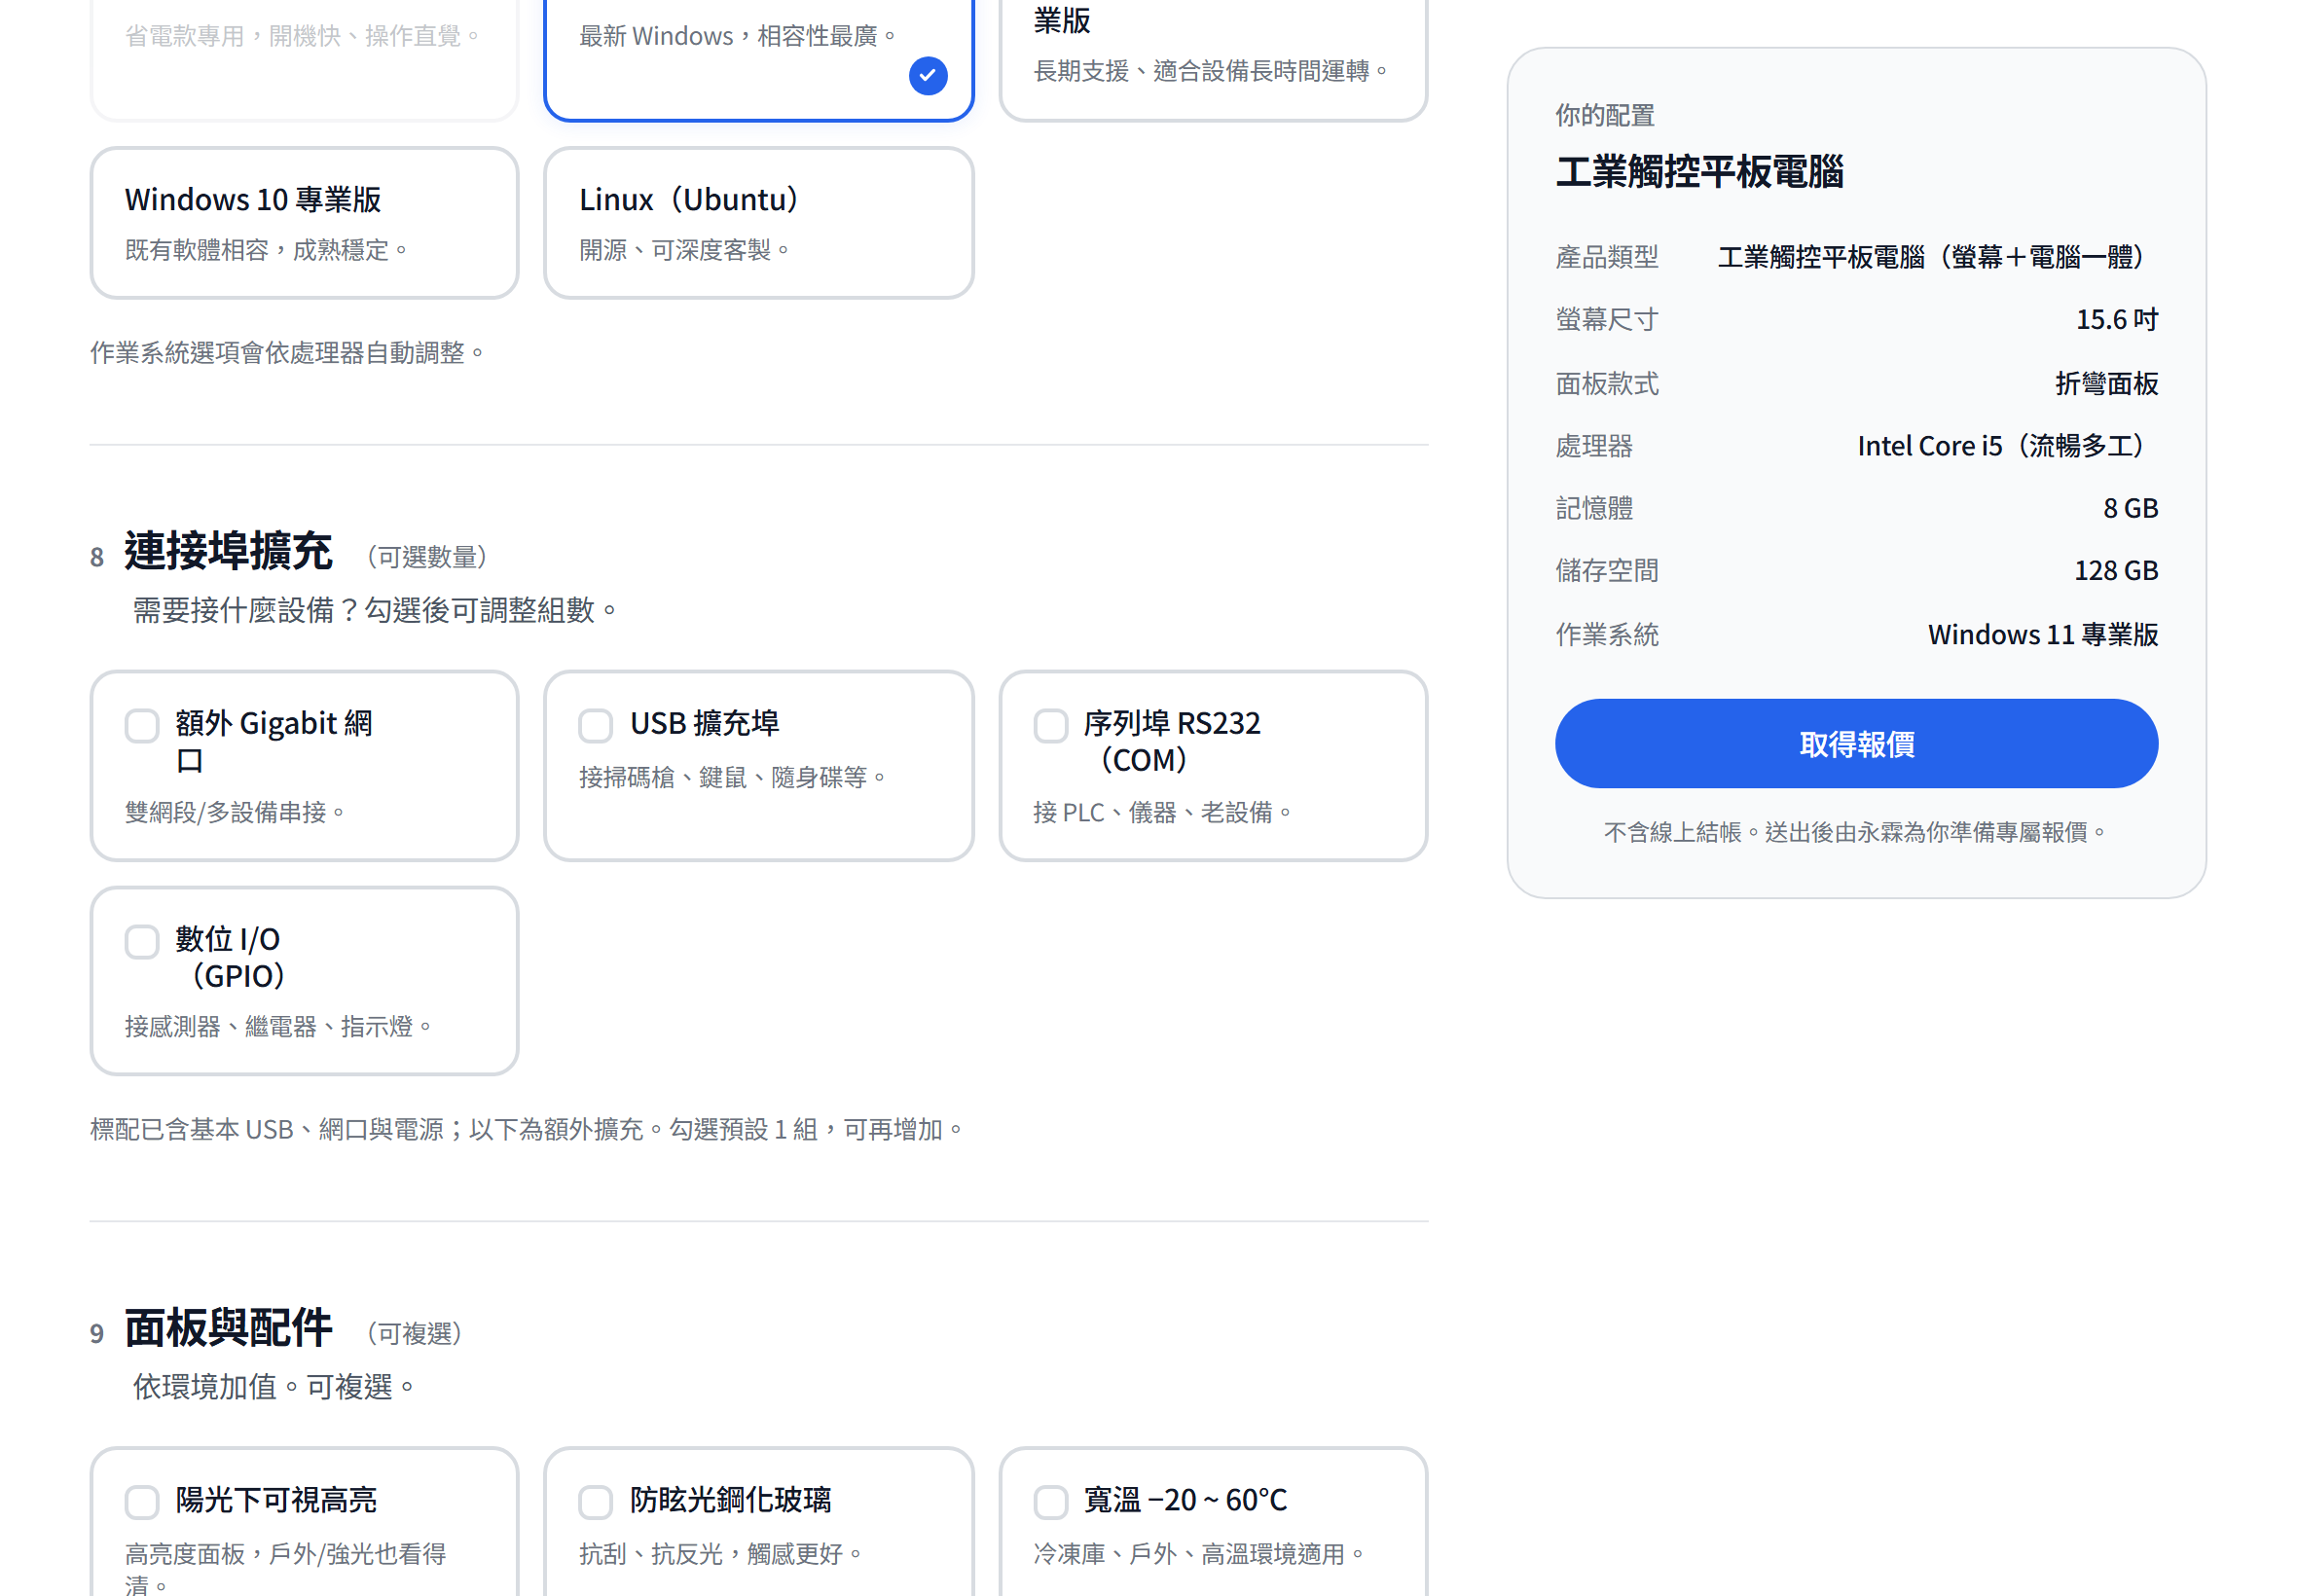
Industrial PC Configurator
An online configurator that ends in a quote request
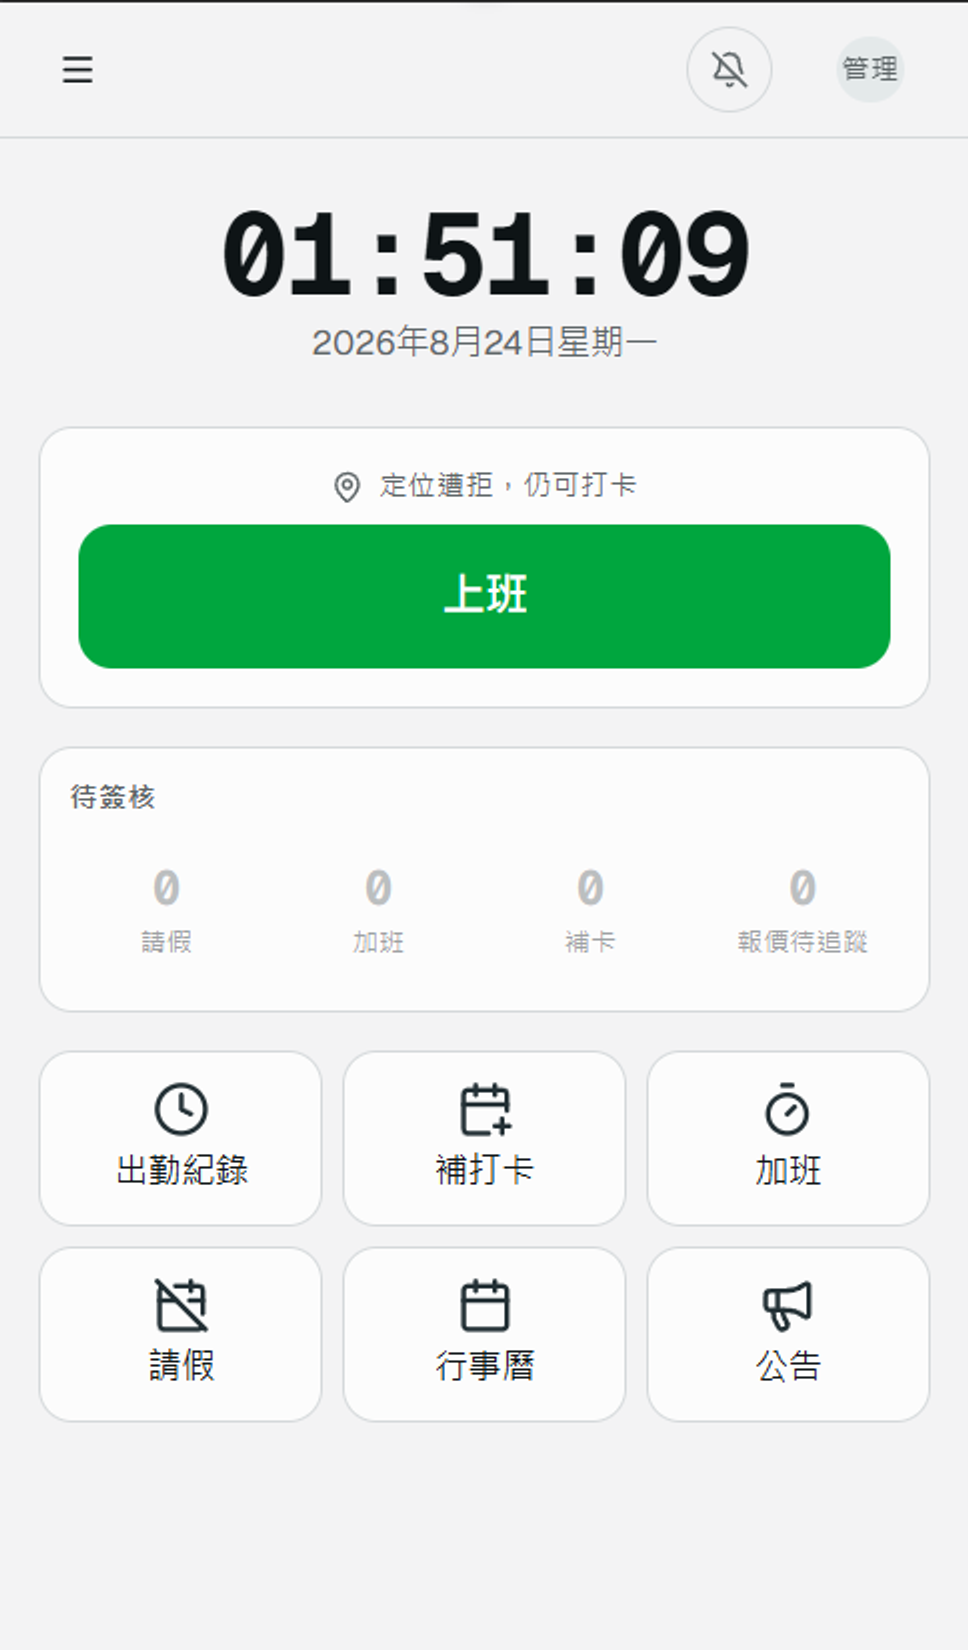
Attendance System
Phone clock-in with location, and every downstream number calculated
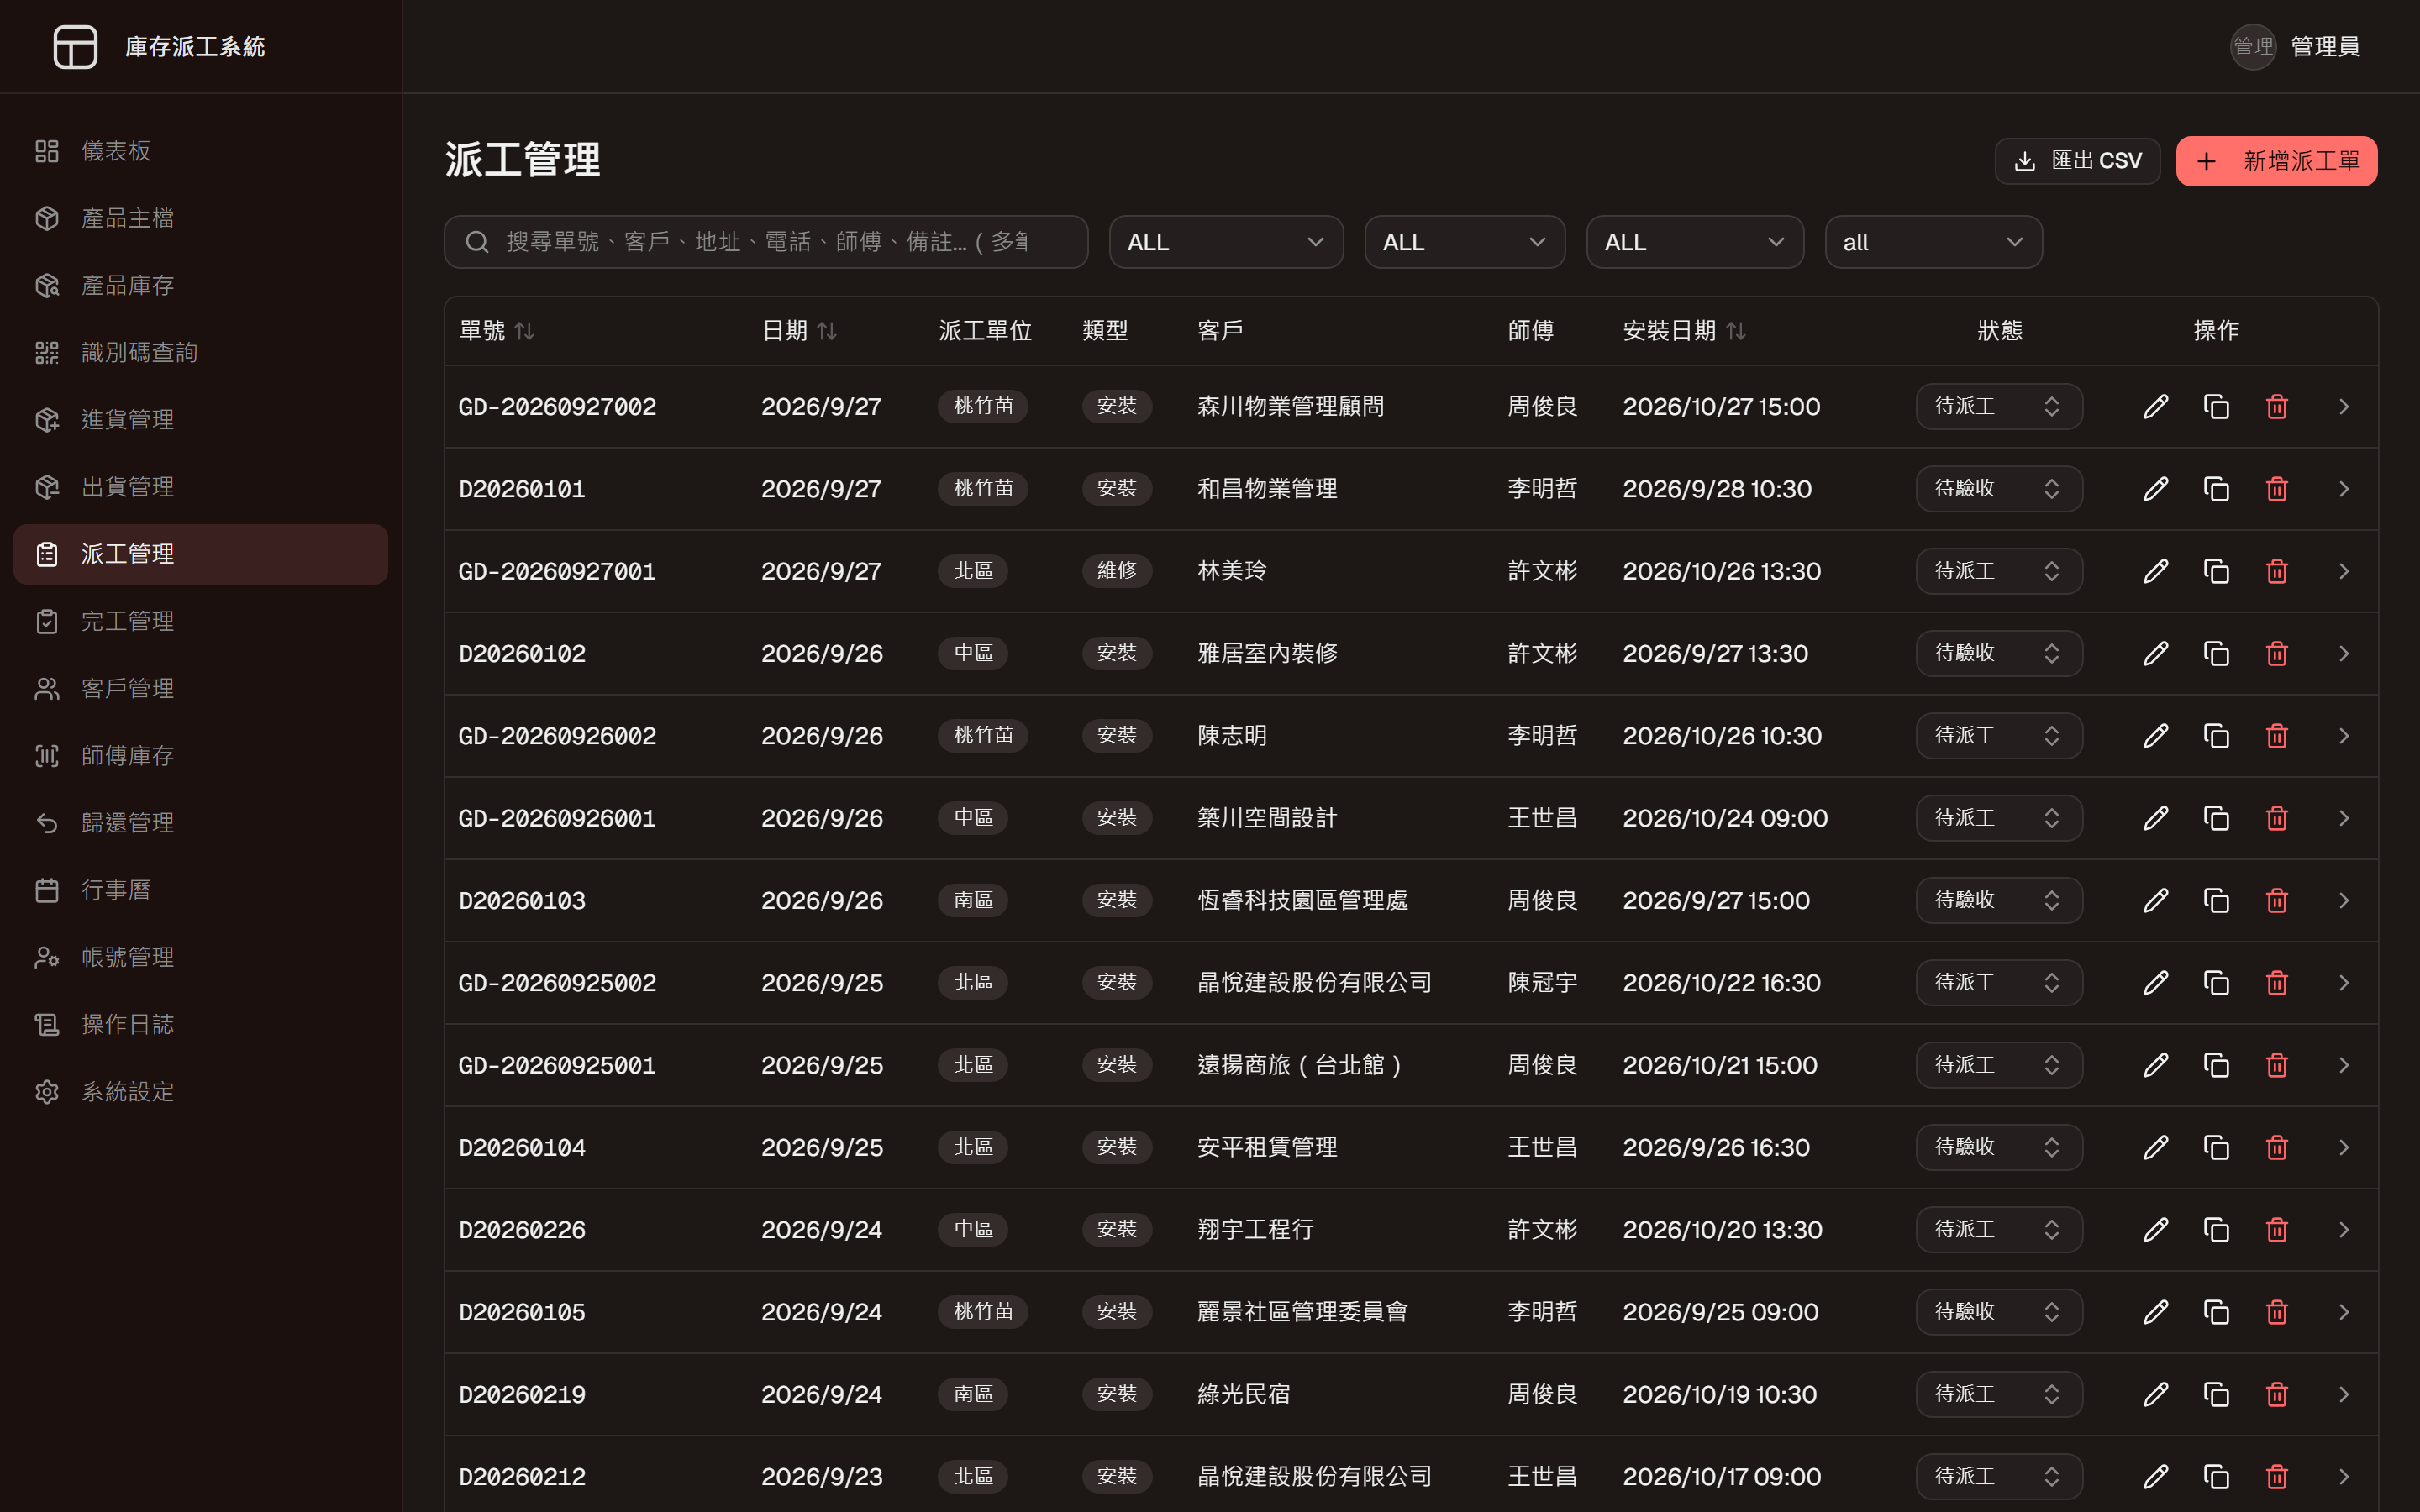
Inventory and Dispatch System
One system from goods-in to job closed